Live Tab

Updated over a week ago
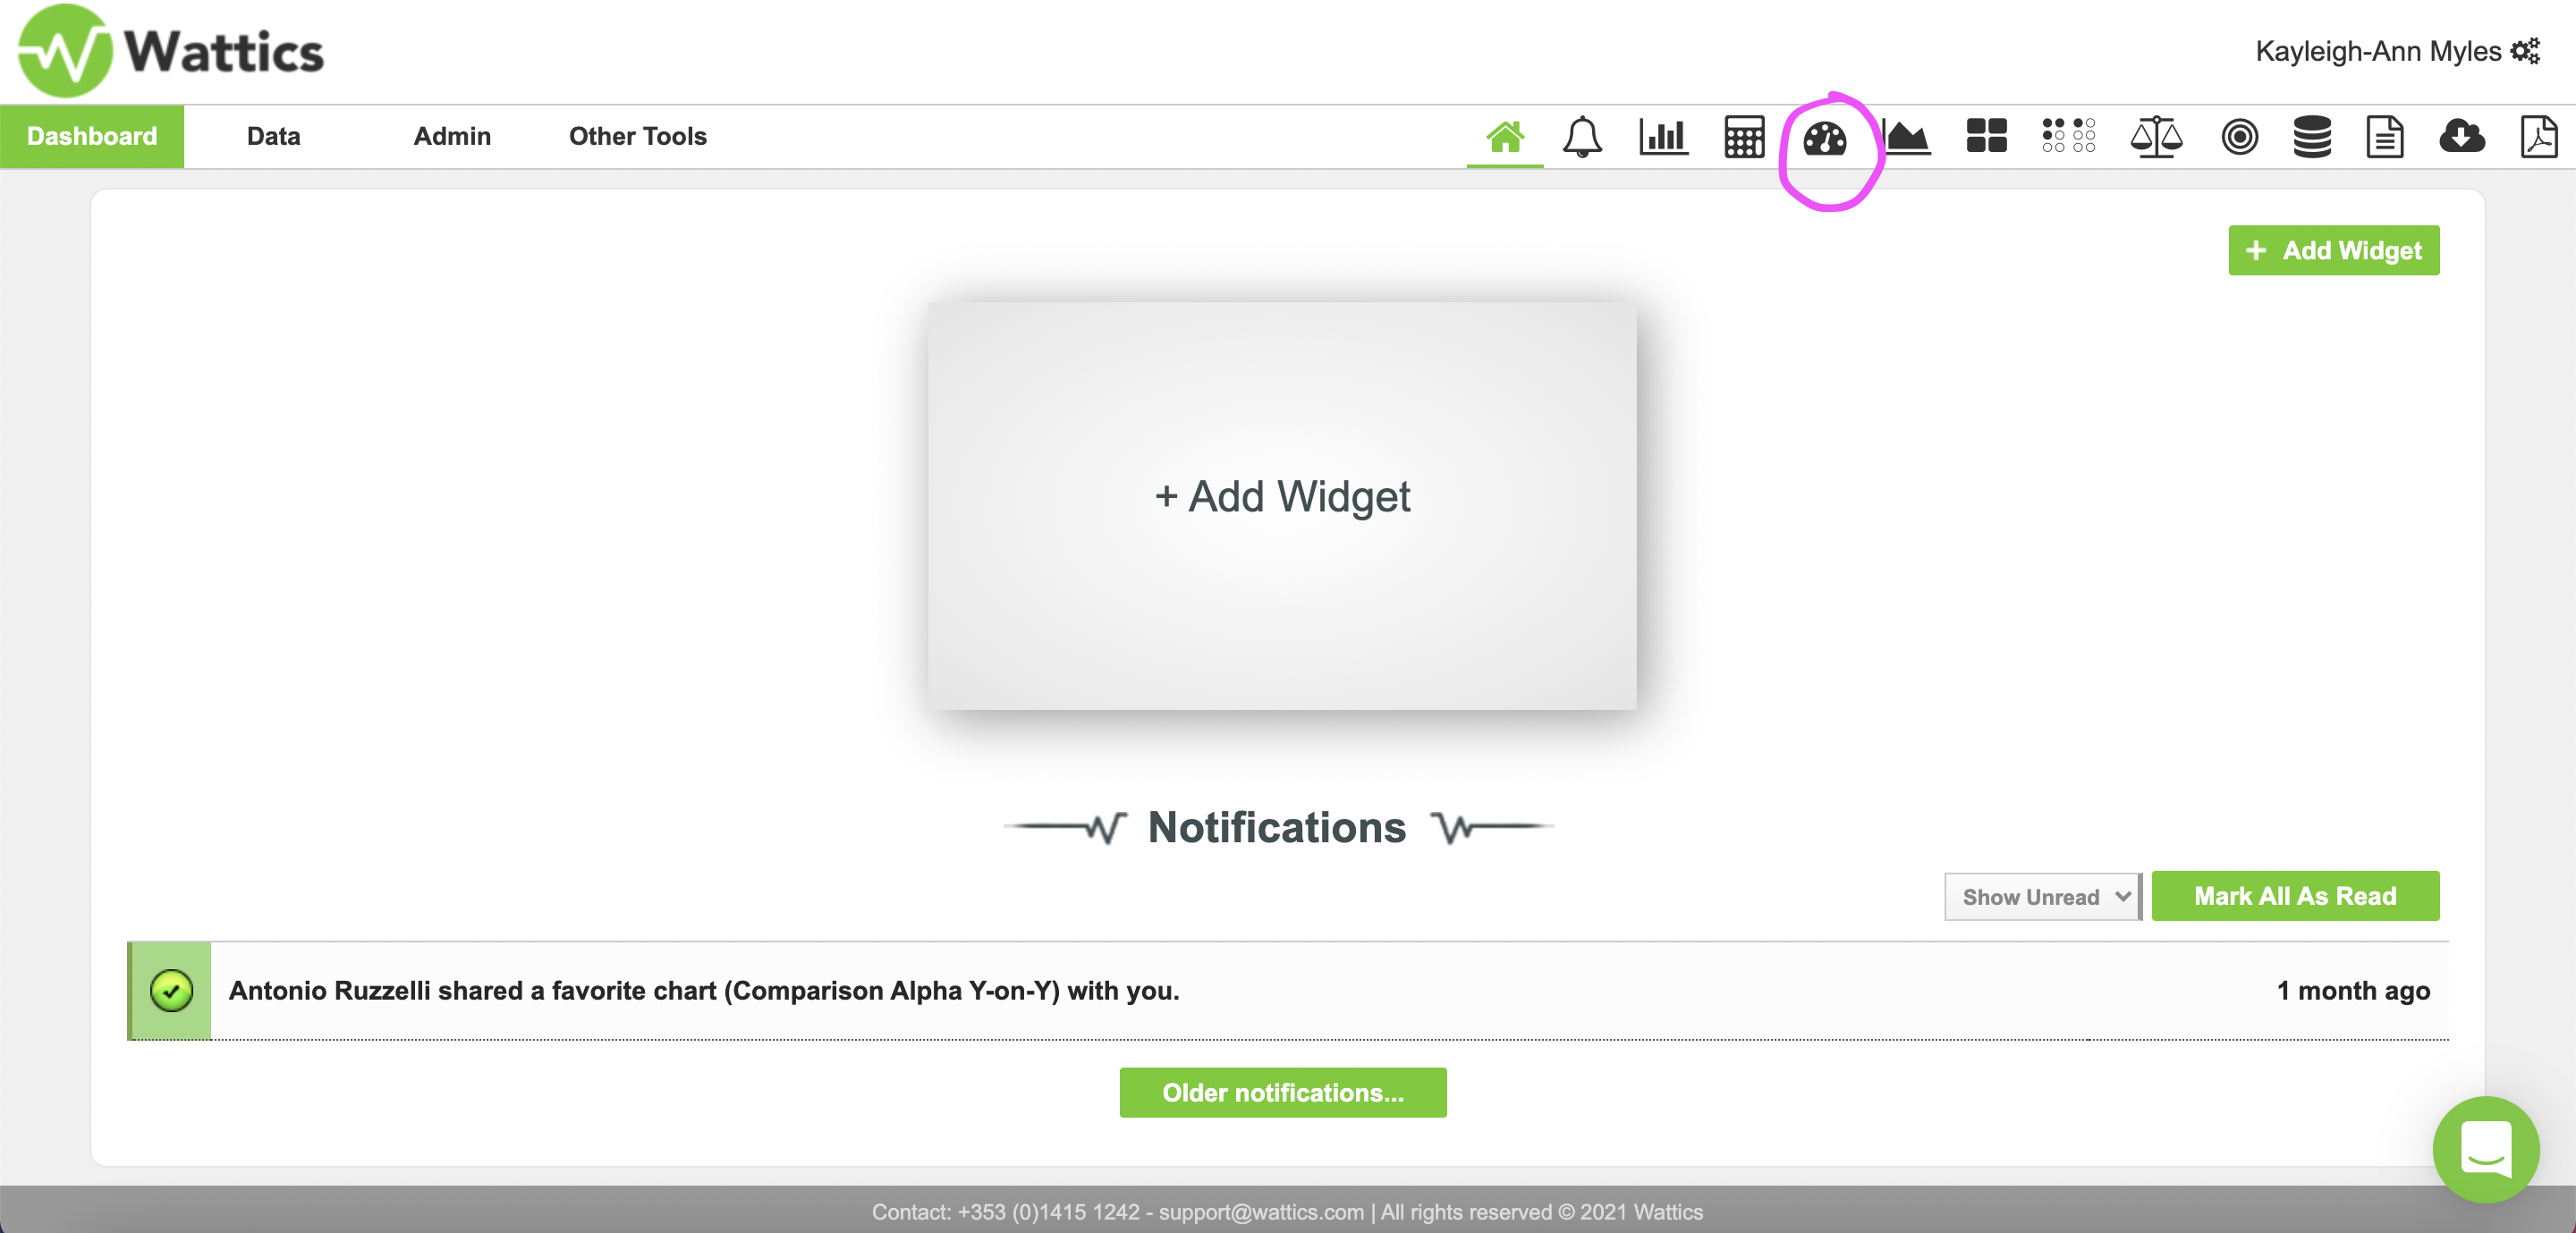
Access and visualise the wide range of electrical parameters for deep power quality analysis with our live feature. You can access the live feature by navigating to the speedometer icon as highlighted below.
The live tab provides a quick visual over view of all the monitored areas for each site. Each gage, as visible below, displays the most up-to-date values along with the time it was last updated.
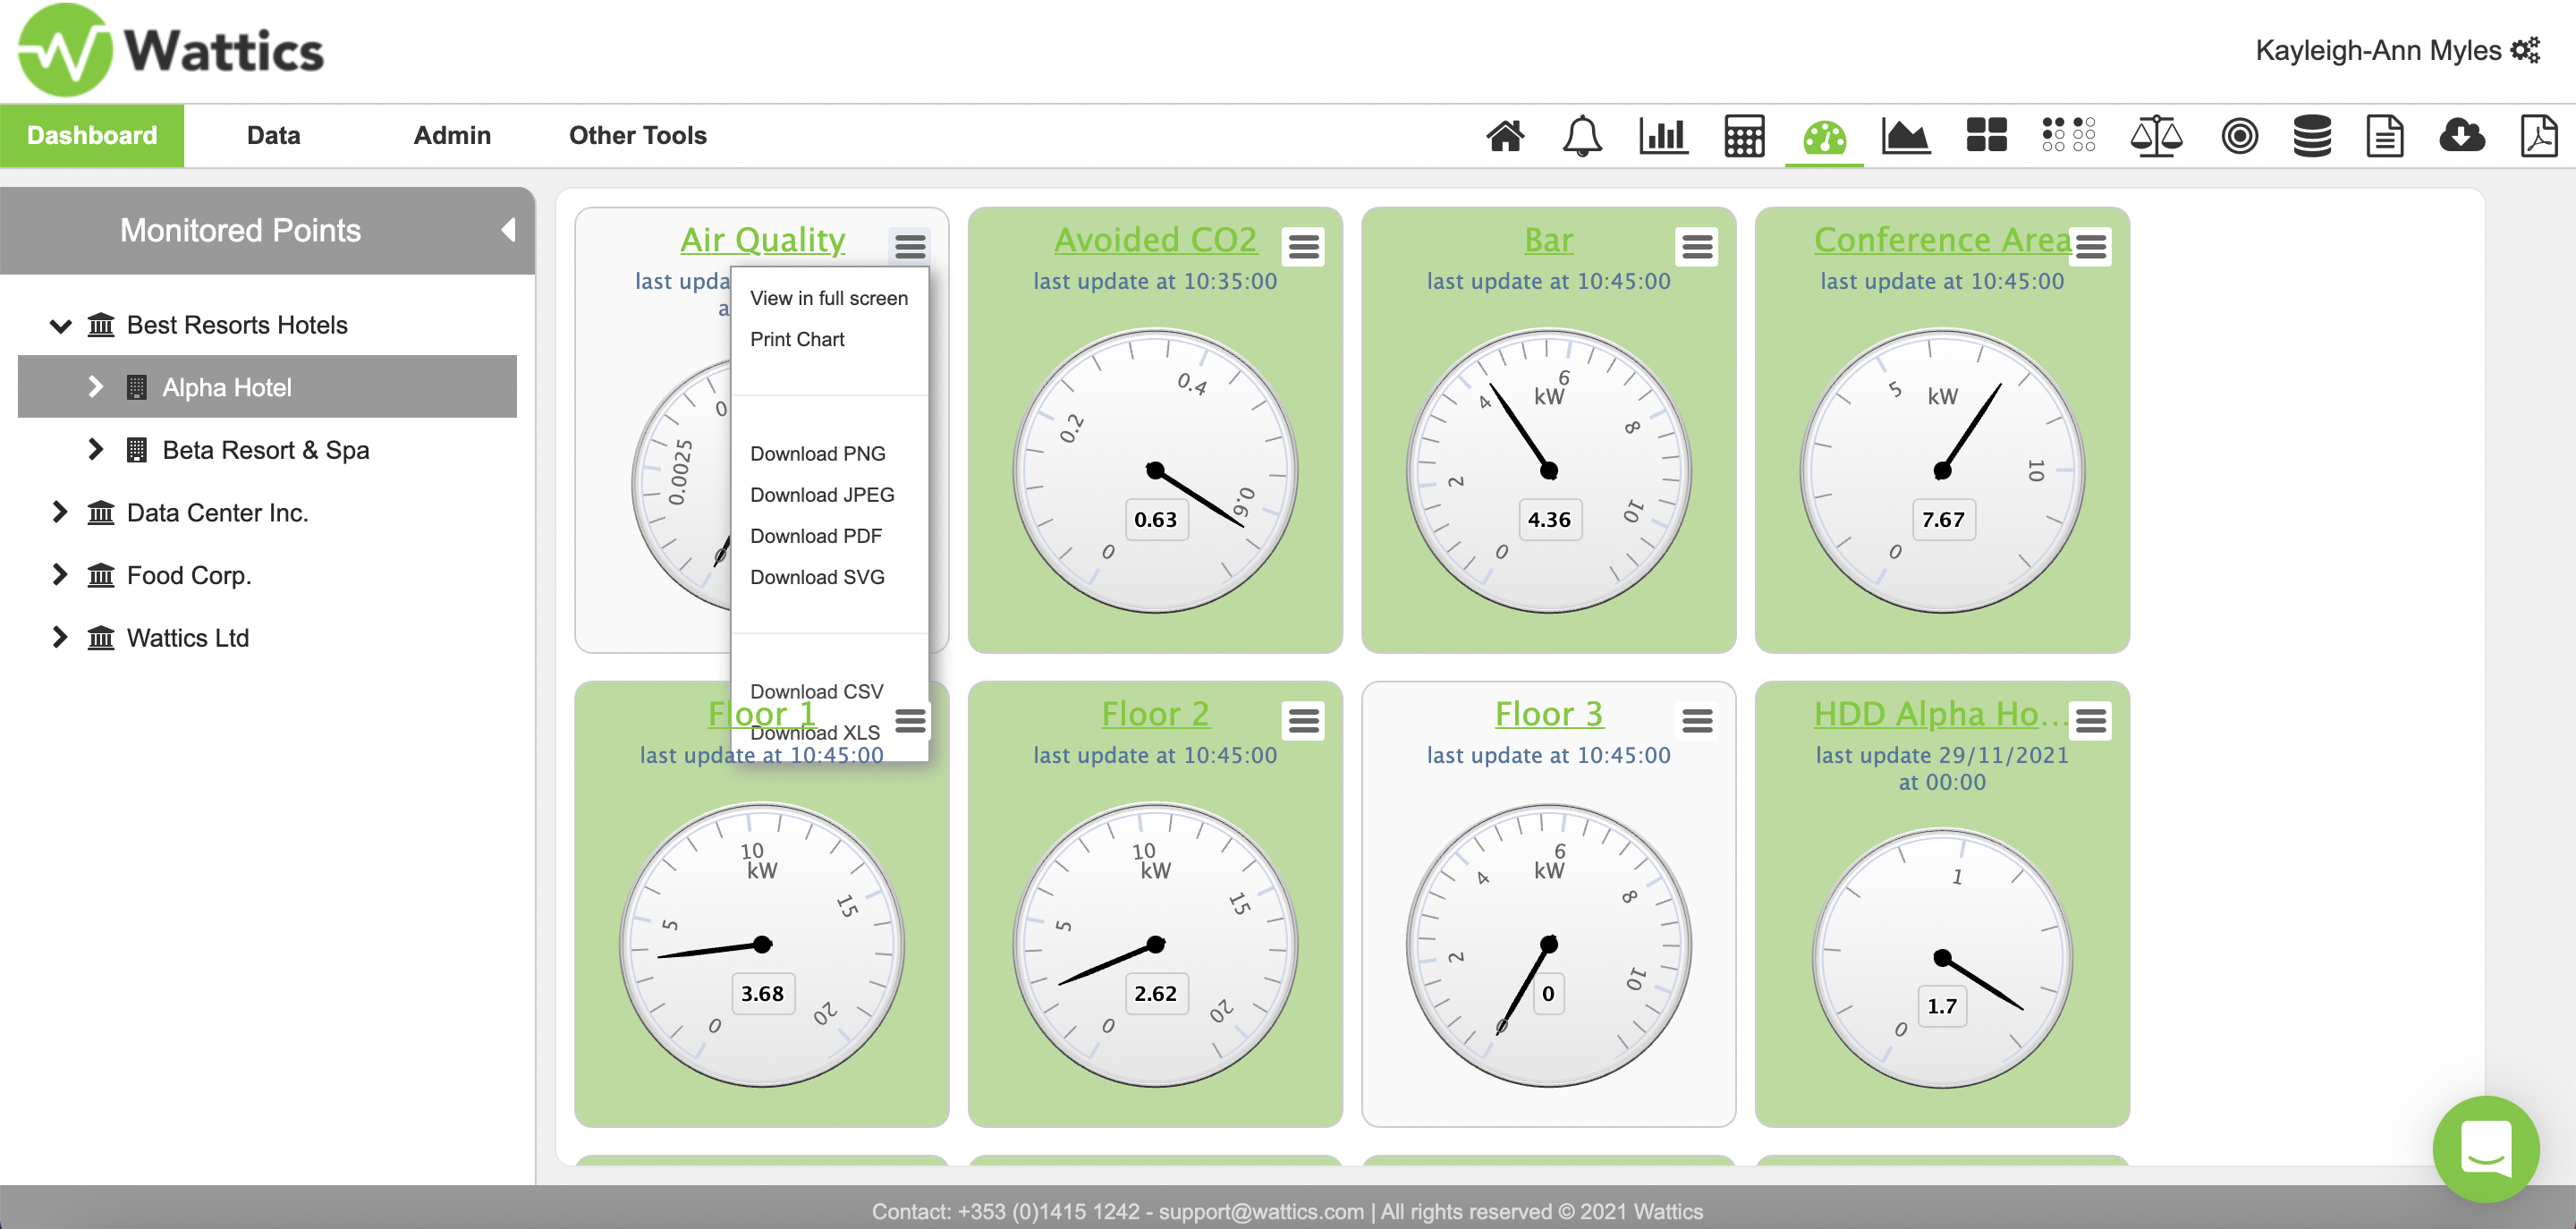
Navigating through different periods of time allows you to visualise the latest kW, PF, V, I and THD readings and analyse daily/weekly patterns. Data can be exported in one click to image, PDF and CSV format. As seen in the drop down menu available in the screenshot above.