

AiElements offers a comprehensive, web-based, energy analytics software platform enabling analysis of energy data for fact-based and insightful decisions that improve organisations’ energy use performance. We understand that our tools cannot fully cover all the analytics needs of our customers, and for that reason we make it easy for you to export your data to third-party web-based software offering complementary functionality.
Tableau software offers interactive data visualization dashboards and reports focused on business intelligence, which can help AiElements customers investigate specific aspects of their energy data. Follow the steps below to export your AiElements data for use with Tableau.
STEP 1: Export your AiElements data
Log in to your AiElements dashboard, click on the Data tab on the top left corner, and finally on the Data Export icon on the right hand side menu. This will open the interface by which you can export your AiElements data to a CSV file.
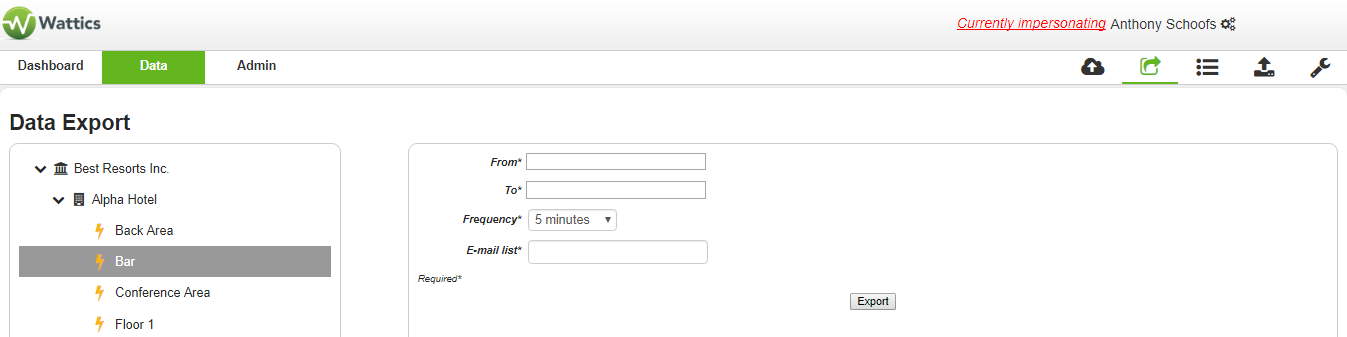
You must select:
-
All the data points you want to export data for – all children data points are selected when you choose a parent data point
-
The time period to consider
-
The time interval you want for your data
-
Your email address to receive a link to download the CSV file generated
Save this CSV file on your computer, this the file that you will import in Tableau.
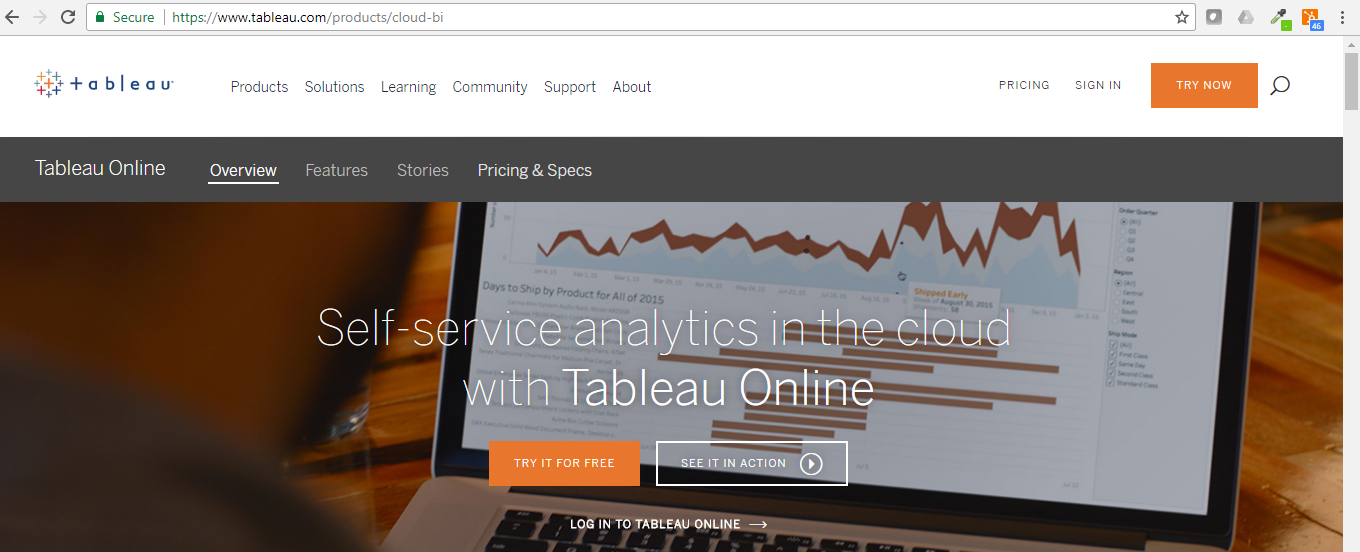
STEP 2: Import your AiElements data to Tableau Desktop
You will need a Tableau account, if you haven’t gone one yet, go to https://www.tableau.com/ and create an account.
Once logged-in, you are presented with a dashboard offering various ways to connect your data sets.
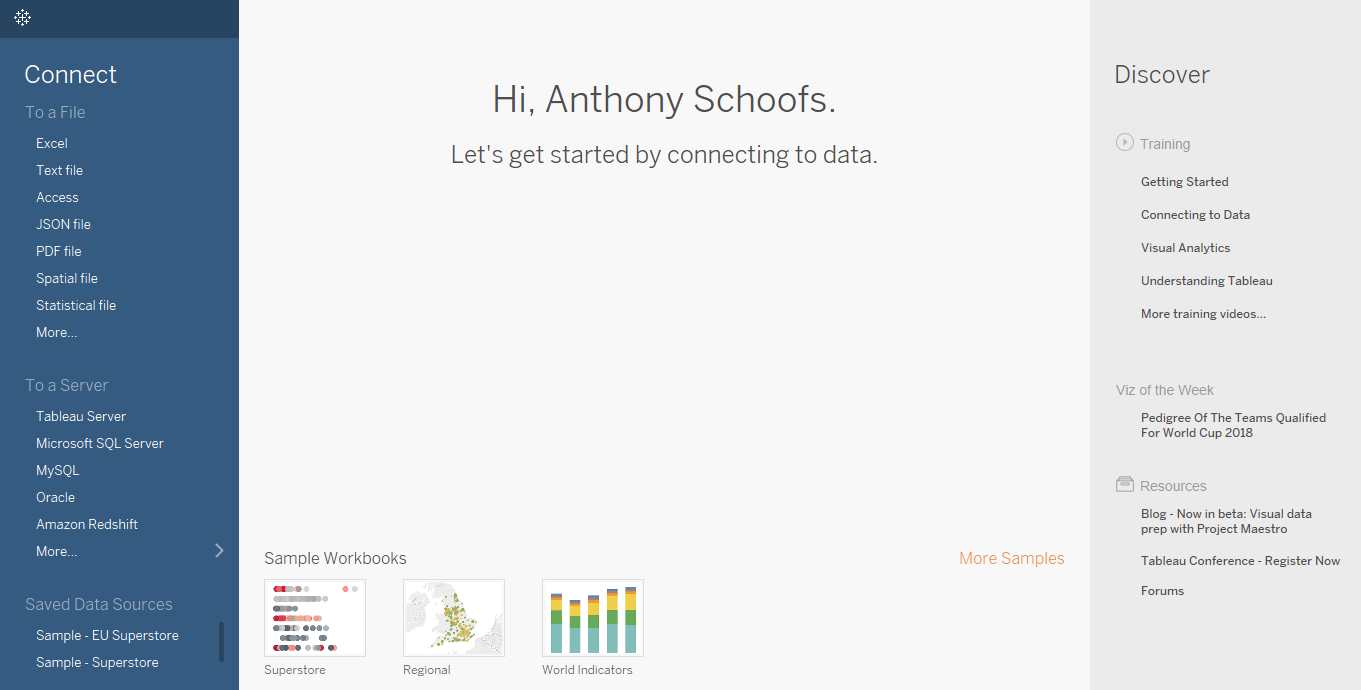
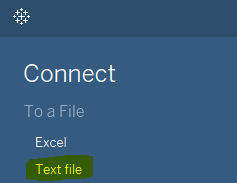
Please select Connect > To a file > Text file in the left menu. This will allow you to search for the CSV file you have exported from AiElements.
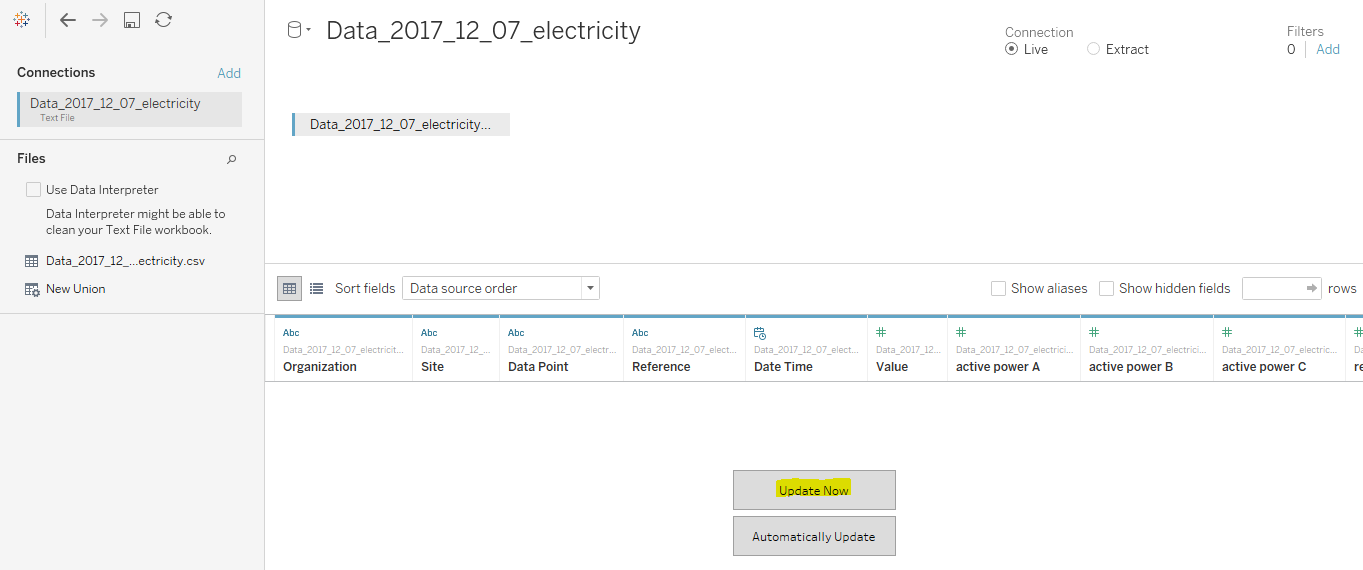
After upload of the CSV file, Tableau software presents you with the various column headers of the CSV file, allowing you to edit the labels and possibly remove columns before the data import. Please make adjustments as necessary if any, and click on the Update Now button to start data import.
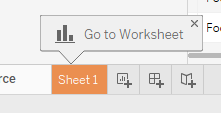
Once data has been imported, click on the Sheet 1 button to go to your Worksheet and start working on your custom reports.
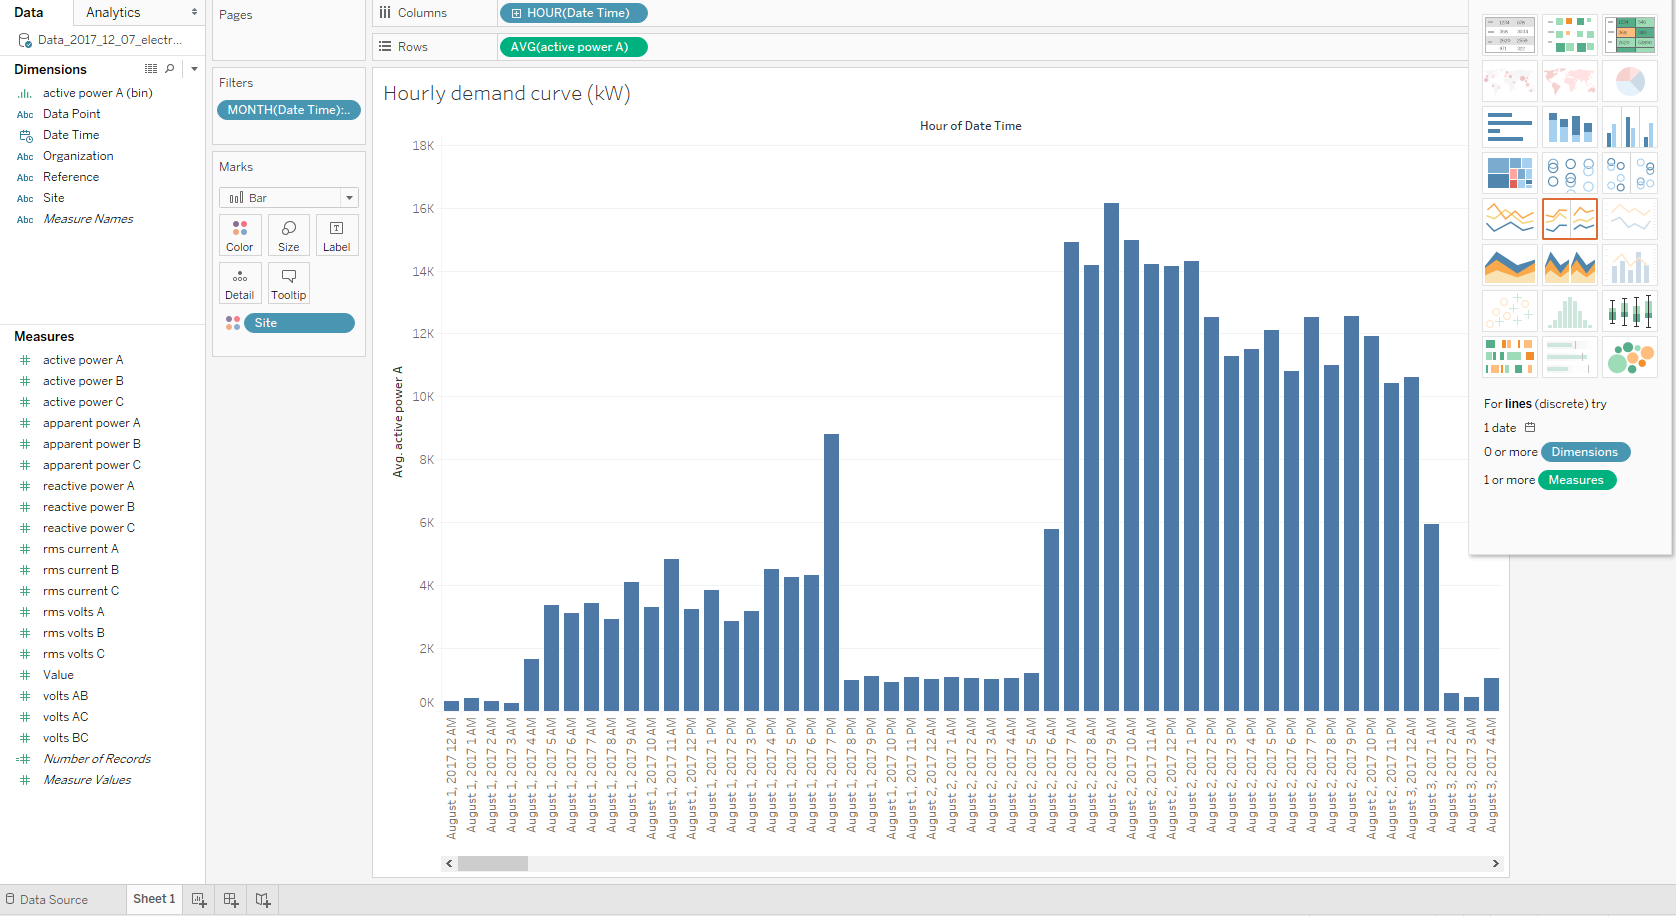
You can now work on any custom visualizations for additional business insights with your dataset, by selecting in the left hand side section what AiElements data you want to use in the graphs. You can also find free training material at https://www.tableau.com/learn/training.
+353 (0)1415 1242 | info@ai-elements.com |
Contact us
Anthony Schoofs
Chief Technical Officer at AiElements
Anthony drives AiElements' innovation on energy efficiency for industrial and grid environments. Anthony is also behind WSNbuzz.com, a blog covering technology advances within the smart grid and IoT markets, and was listed in 2011 amongst the top 100 IoT thinkers. Anthony was recently awarded the Globe Sustainability Research Award for his contribution to advancing knowledge on sustainability.
Latest posts by Anthony Schoofs (see all)
-
Export your AiElements data to Tableau business intelligence software - December 8, 2017
-
Connect your Schneider PowerLogic PM8000 meter to AiElements with the Obvius AcquiSuite EMB A8810 Data Acquisition Server - December 7, 2017
-
Connect your EIG Nexus 1500 meter to AiElements with the Obvius AcquiSuite EMB A8810 Data Acquisition Server - December 7, 2017